Velocity and Distribution


Sales Forecasting 101 for CPG Brands: Distribution and Velocity
Introduction
For both emerging and late stage CPG brands, success and growth hinges on the ability to effectively make informed decisions and achieve business predictability through sales forecasting.
Being able to distribute products and maintain optimal velocity in the market for reliable commercial outcomes is a difficult process. The value chain and go-to-market strategy is complicated, especially for first-time founders and newer brands. There’s a complicated web of brokers, distributors, sales leaders, direct sales, DSD, etc, all which can eat away at the gross margin.
Although there’s no universal answer and playbook to manage this challenge, understanding distribution and velocity is an important segment of driving sales momentum. This blog will explore the data and strategies we recommend to improve your go-to-market strategy and drive sustainable growth.
Understanding Distribution:
Distribution forms the backbone of any CPG brand's market presence. It refers to the number of retail stores, or “doors” that your brand is available in. Here's why distribution is crucial:
- Reach: Effective distribution ensures that your products are available where your target audience shops. Whether it's supermarkets, convenience stores, online platforms, or specialty retailers, widespread distribution increases brand visibility and accessibility.
- Market Penetration: The broader your distribution network, the greater your potential market penetration. By reaching more shelves, you have the opportunity to capture the attention of new consumers and expand your customer base.
- Competitive Edge: Brands with superior distribution networks can outmaneuver competitors by offering greater availability and convenience to consumers.
Distribution Data
CPG brands cannot properly manage their brand’s distribution if they do not have access to the historical data on where the brand is being sold and how much is purchased at the store level. Data can be purchased through multiple syndicated data providers such as SPINS, IRI, Nielsen, or Retailer-specific data platforms.
This data will include Retail Sales ($s and Units), Distribution, Velocity, by Market and Time Period.
Understanding ACV
Brands can measure distribution based off of how many stores they are selling in, however, it doesn't fully tell the story of how strong their distribution is. A more comprehensive distribution measure is % ACV, which simply put, measures the volume weighted % of stores you are selling in for a Retailer, Market, or Channel.
% ACV is used to determine the share of total market value; it’s a measure of a brand’s availability weighted by retail sales value, in a market area. In other words, it’s a percentage of total ACV where your brand is scanned versus the value of the total market ACV.
Strategies for Distribution Optimization:
To optimize distribution and maximize market impact, CPG brands can employ the following strategies:
- Measured Roll-out: Depending on your target customer, a measured roll-out that targets specific geographies will allow you to achieve the appropriate ACV penetration without suffering velocity decline. If you expand distribution too quickly, then you risk a cash-flow crunch with the costs incurred in entering into new stores, especially if the velocities are already low.
- New Supplier Programs: Oftentimes, large distributors will have programs such as KeHE Elevate, which is focused on bringing newer brands into the market through distribution programs and discounts.
- Data-Driven Insights: Leverage data analytics to identify high-potential markets and optimize distribution routes in demographics that your brand will resonate the most with. By analyzing sales data and market trends, brands can make informed decisions to allocate resources effectively and prioritize expansion efforts.
Understanding Velocity:
Velocity refers to the rate at which your product sells when it’s available to consumers on the shelf. It measures the speed of sales turnover and is a key indicator of market demand and product performance.
Here's why velocity matters:
- Revenue Generation: Higher velocity translates to increased sales volume, generating revenue and driving profitability for CPG brands.
- Inventory Management: Maintaining optimal velocity is essential for efficient inventory management. By aligning production and distribution with demand patterns, brands can minimize excess inventory, reduce carrying costs, and avoid stockouts.
- Consumer Satisfaction: Rapid product turnover indicates strong consumer demand and satisfaction. By consistently meeting consumer expectations for availability and freshness, brands can build loyalty and enhance brand reputation.
- Analyzing Promotions: Promotional data contains a lot of noise if the brand is measuring the result solely based on sales. Measuring velocity before, during, and after a promotion can provide the strongest signal of the level of success for a promotion.
Strategies for Velocity Optimization:
To enhance velocity and accelerate sales momentum, CPG brands can implement the following strategies:
- Demand Forecasting: Utilize advanced forecasting techniques to anticipate market demand and adjust production and distribution accordingly. By accurately predicting consumer preferences and seasonal fluctuations, brands can optimize inventory levels and minimize stock obsolescence.
- Pricing and Promotional Campaigns: Ensure that everyday price points on shelf are optimal, paired with targeted marketing and promotional campaigns to stimulate demand and increase product velocity. Discounts, bundling offers, and limited-time promotions can incentivize consumers to make purchasing decisions and drive sales.
- Product Innovation: Continuously innovate and introduce new products to sustain consumer interest and maintain velocity. By refreshing product offerings and responding to evolving market trends, brands can attract new customers and encourage repeat purchases.
- Optimize shelf placement: Ensure that products are stocked on retail shelves and prioritize shelf placement. Eye level is the best, followed by waist level, top shelf, and knee level. Depending on the product, this may vary. For instance, placing candy items on lower shelves has shown to improve sales since it’s in easy reach of children.
Choosing the Right Velocity Measure
At a basic level, the equation for velocity is

The major measures for velocity are:
- Sales per Store
Though it's a simple measure , more bottoms up forecasts at the account / SKU level are built based on Sales per Store Selling velocities The most common are Base UPSPW or Total UPSPW (units per store per week.
- Other commonly used measures: Sales per Point of Distribution (SPPD) or Sales per $mm ACV. These are used for higher level velocity comparisons across markets.


Conclusion:
Distribution and velocity are integral components of success for CPG brands. Brands can typically start off with sales forecasting on Excel before graduating to more sophisticated tools.
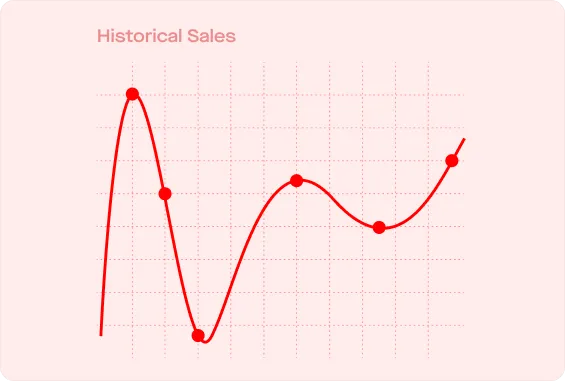
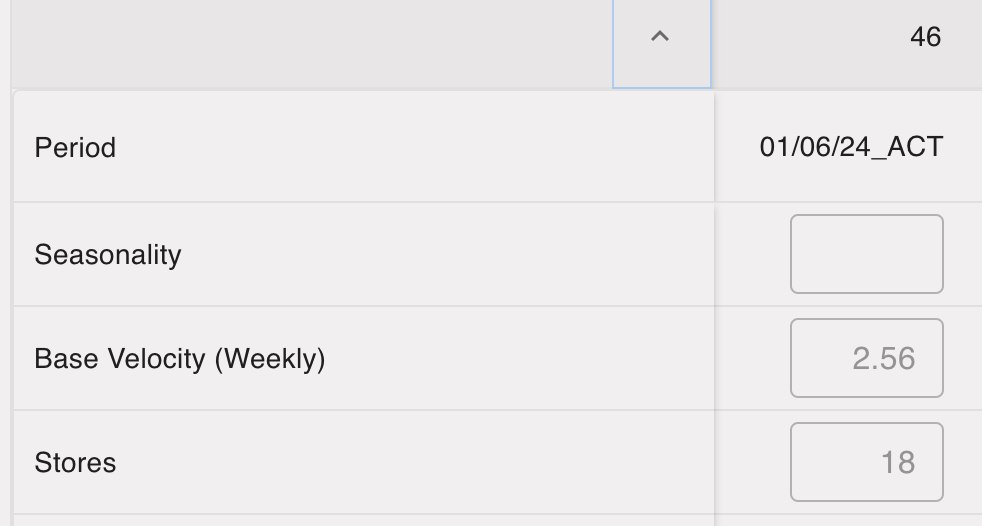
Using Velocity and Distribution with Confido
Confido can streamline velocity and distribution calculations with our sales forecasting tool and promo analytics. Forecasts will dynamically adjust based on SPINs and other syndicated data uploads.
.gif)
Re-forecasting
Confido also enables users across te entire sales team to collaborate on the sales forecast.
With forecasting, the sales / trade manager can assign forecasts for each user, and track due dates and audit logs for each forecast. After the forecast assignment period, the manager can merge forecasts, to gain a more accurate snapshot of revenue predictions.
Contact us today to see how you can improve your sales forecasting processes.
.webp)
.svg)
Explore More Resources